
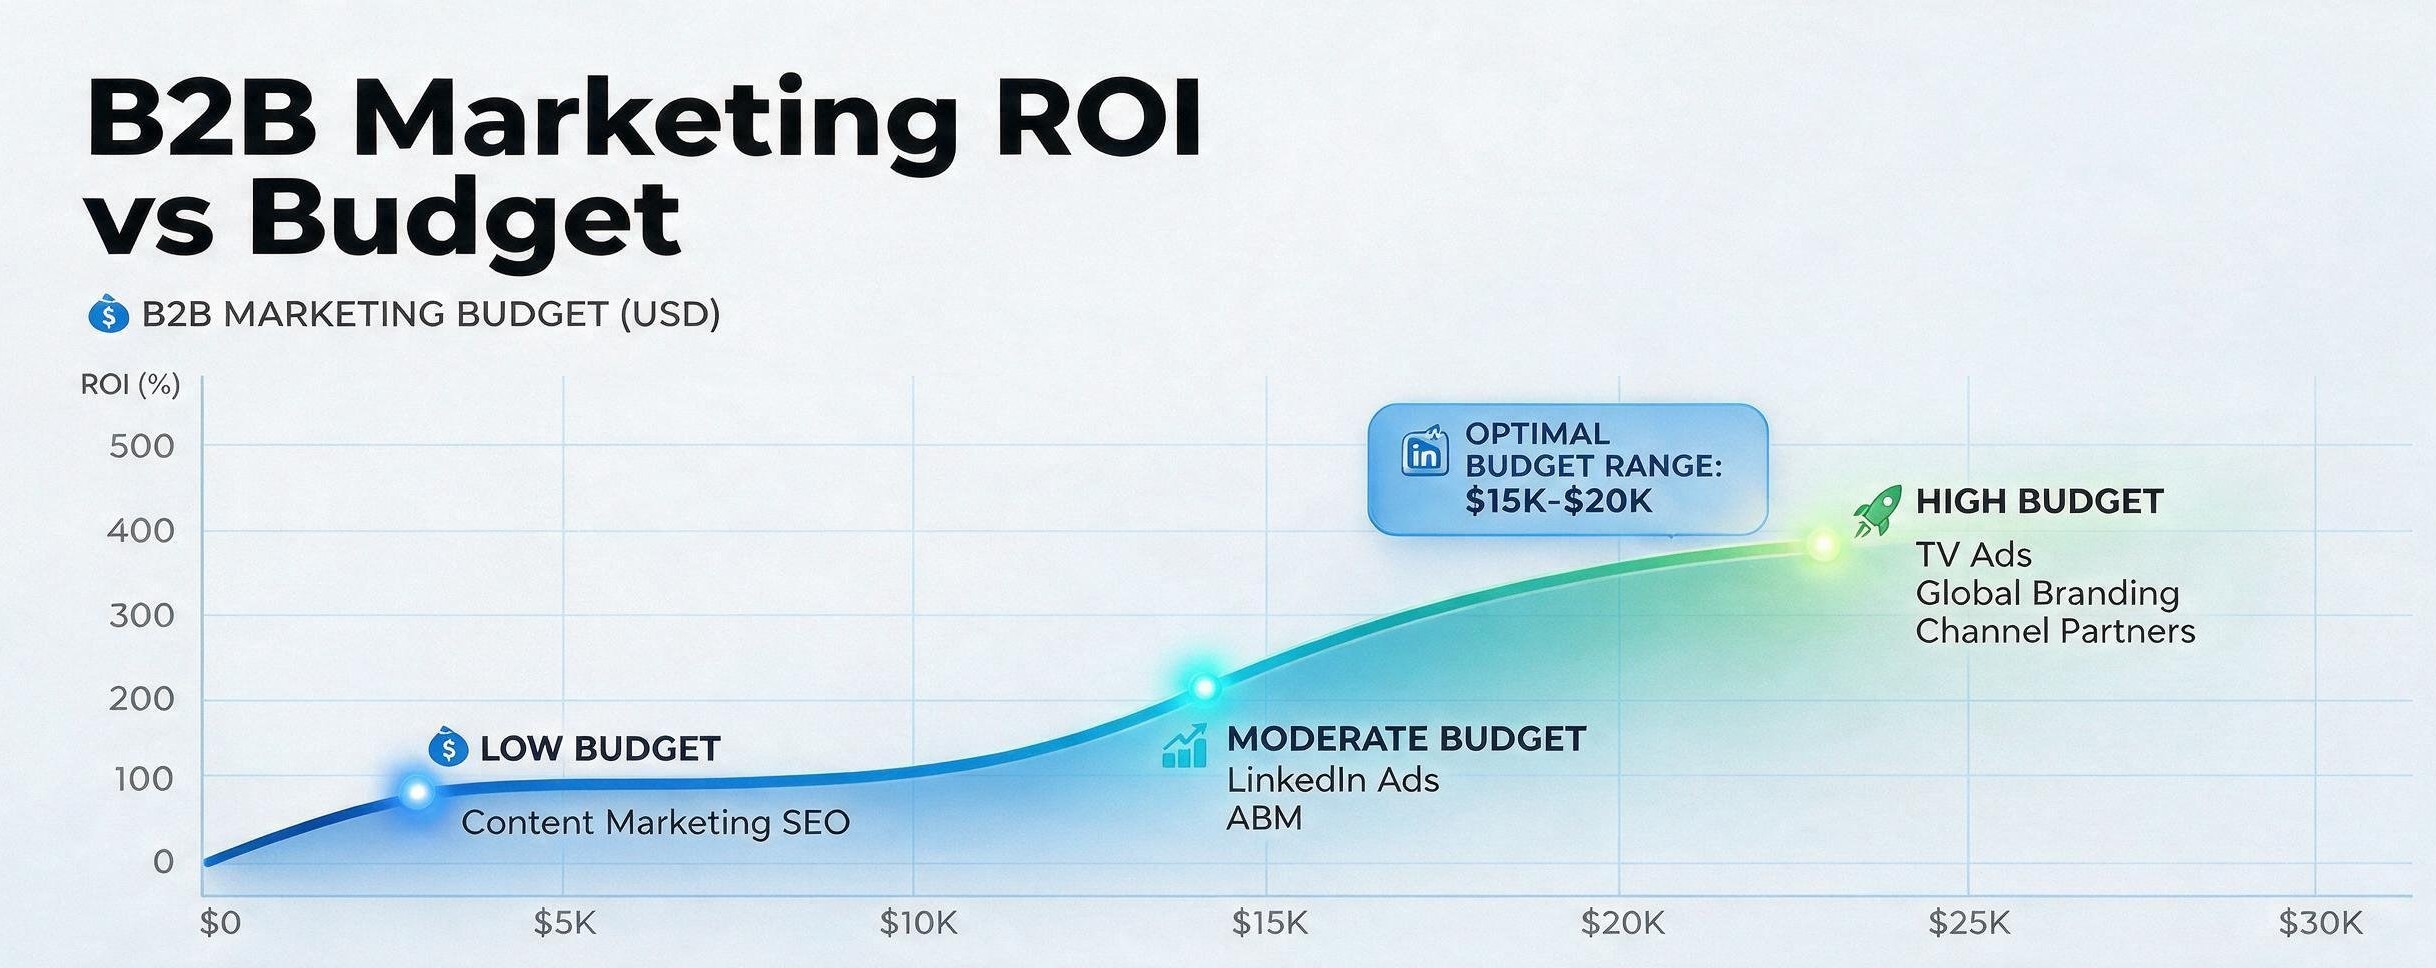
B2B advertising ROI calculation methods sound like a solved problem until you sit in a budget review and someone asks why a $40,000 monthly ad spend only produced twelve “qualified” leads. Most finance teams don’t trust marketing’s math, and honestly, they’re often right not to. The models taught in most playbooks were built for e-commerce, where the buyer clicks and buys in one sitting. B2B doesn’t work that way. Deals take months, involve six or seven stakeholders, and touch a dozen channels before a contract gets signed. If your ROI math ignores that reality, it’s fiction with a nice chart attached.
This guide looks at:
- Why Most B2B advertising ROI calculation methods fail before you even run the numbers
- The core B2B advertising ROI calculation methods worth using
- B2B marketing ROI metrics that actually predict revenue
- How to calculate B2B digital marketing ROI across channels
- How to measure B2B content marketing ROI without guesswork
- How to build a B2B marketing ROI reporting cadence that holds up in the boardroom

Why Most B2B Advertising ROI Calculation Methods Fail Before You Even Run the Numbers
Most B2B advertising ROI calculation methods fail because they measure activity instead of revenue impact. They focus on counting clicks, form fills, and impressions but ignore sales cycle length, deal size variance, and multi-touch buying committees. Picking the right unit measurement from the start is the fix to this.
Here’s what we’ve seen derail otherwise smart marketing teams, over and over.
The Attribution Window Trap
A 30-day attribution window makes sense for a subscription box. It’s useless for enterprise software with a nine-month sales cycle. When your attribution window closes before the deal does, you’ll systematically undercount every channel that plays an early-funnel role—content, thought leadership, top-of-funnel LinkedIn campaigns—and overcredit whatever touched the deal last. Sales tends to get the credit; marketing eats the blame.
Blending Brand and Demand Spend Into One Number
Many companies dump brand awareness spend and bottom-funnel demand generation spend into a single marketing budget line, then calculate one blended ROI figure. This number doesn’t tell you anything because brand spend pays off over quarters, and sometimes years. Demand spend should show returns in weeks. Averaging them together produces a figure that satisfies no one and misleads everyone. The CFO thinks demand gen is underperforming, and the CMO can’t defend brand investment with a straight face.
The Core B2B Advertising ROI Calculation Methods Worth Using
The most reliable B2B advertising ROI calculation methods combine multi-touch attribution, marginal (incrementality) testing, LTV-to-CAC ratios, and pipeline-weighted ROI. No single method can tell the whole story. Layer up two or more to get a defensible number finance will actually support.
1. Multi-Touch Attribution ROI
Multi-touch models split credit across every touchpoint in the buyer journey rather than handing it all to the first or last click. Time-decay and U-shaped models tend to work best for B2B, since they weight the touches closest to the initial inquiry and the final sales conversation more heavily—the moments that usually carry the most influence. The formula is straightforward:
Weighted Attribution ROI = (Revenue Attributed by Touch Weight − Ad Spend) / Ad Spend
The catch is that multi-touch attribution needs clean CRM data with consistent UTM tagging across every campaign.
2. Marginal ROI (Incremental Testing)
Marginal ROI calculation method is uncomfortable and that’s why many teams skip it. In this method, you run a geo-holdout or audience-holdout test, pausing ad spend in a comparable market or segment, and measure the revenue delta against the market where spend continued. What you’re isolating is the marginal, incremental lift your ad dollars actually caused, stripped of organic demand that would have converted anyway.
- Pick two comparable segments (region, industry vertical, or account tier)
- Run ads in one, pause in the other, for 60 to 90 days minimum
- Compare pipeline and closed-won revenue between the two
- Attribute the delta, not the total, to your ad spend
Incrementality testing is the closest thing to ground truth in B2B advertising ROI calculation methods, and most agencies never run it because it requires patience and a willingness to be wrong.
3. Customer Lifetime Value to CAC Ratio
A single deal’s ROI means little if long-term customer retention fails. The LTV:CAC ratio ROI calculation method ensures you think in cohorts and not campaigns.
LTV:CAC = (Average Contract Value × Gross Margin % × Average Customer Lifespan) / Customer Acquisition Cost
A 3:1 ratio is generally considered healthy in B2B; anything under 1:1 means you’re funding growth you’ll never recover. What most teams miss is segmenting this ratio by channel — your LinkedIn-sourced accounts might retain twice as long as your cold outbound accounts, which completely changes which channel deserves more budget.
4. Pipeline-Weighted ROI
Instead of waiting for closed-won revenue (which can take a year in enterprise sales), weight pipeline by stage-specific close probability:
Pipeline-Weighted Revenue = Σ (Deal Value × Stage Close Probability)
This gives finance an early, defensible signal without forcing marketing to wait a full sales cycle to prove value. It’s not a replacement for actual revenue reporting — it’s a leading indicator that keeps budget conversations from stalling for months.
B2B Marketing ROI Metrics That Actually Predict Revenue
The B2B marketing ROI metrics that predict revenue best are MQL-to-SQL conversion velocity, cost per opportunity (not cost per lead), and sales-cycle-adjusted ROI. Lead volume alone is a vanity metric, it tells you nothing about whether those leads can actually close.
1. MQL-to-SQL Conversion Velocity
Volume of leads is the metric everyone reports and the one that matters least on its own. What matters is how fast — and at what rate — marketing-qualified leads become sales-qualified. A channel generating fewer leads with a 40% MQL-to-SQL rate is outperforming one generating triple the volume at 8%. Track this by channel monthly. The channel with the best raw lead count is rarely the channel with the best conversion velocity, and budget decisions based on volume alone are budget decisions made backward.
2. Cost Per Opportunity vs Cost Per Lead
Cost per lead is the metric that gets marketing teams fired for the wrong reasons. It rewards volume and punishes quality. Cost per opportunity — spend divided by leads that actually progress into a real sales opportunity — is a far more honest B2B marketing ROI metric because it filters out the tire-kickers and content downloaders who were never going to buy.
3. Sales Cycle-Adjusted ROI
If your average enterprise deal takes 240 days to close, reporting ROI on a quarterly basis without adjusting for cycle length will always look artificially weak in Q1 and artificially strong once deals from prior quarters finally land. Normalize by tagging every deal with its originating campaign date and reporting ROI against a rolling cohort window that matches your actual average sales cycle — not the calendar quarter your finance team happens to use.
Calculating B2B Digital Marketing ROI Across Channels
To calculate B2B digital marketing ROI you need channel-specific benchmarks not one formula. For example, paid search, LinkedIn Ads, and ABM platforms each has its own cost structures, buying intent signals, and typical time-to-conversion. This means that if you compare them using a single flat ROI number, you won’t get an accurate result.
Paid Search and LinkedIn Ads
Paid search captures active intent (when someone types the problem into Google). LinkedIn ads interrupt passive browsing with a relevant message. Comparing their raw conversion rates head-to-head is like comparing apples to a much more expensive orange. To know the ROI of paid search, look on cost-per-opportunity against high-intent keywords. For LinkedIn, consider penetration within your target list (for example, how many named accounts actually engaged with your post).
Account-Based Marketing Spend
ABM doesn’t fit standard B2B digital marketing ROI models at all, because you’re not optimizing for volume—you’re optimizing for engagement depth within a fixed list of named accounts. The right metric here is account engagement score lift and pipeline velocity within the target account list, measured against a control group of similar accounts that received no ABM treatment.
Retargeting and Nurture Sequences
Retargeting rarely deserves full attribution credit for a conversion. This is because the buyer usually discovered you somewhere else first. Therefore, retargeting ROI should be treated as an assist metric. Measure the lift in conversion rate for retargeted accounts versus a comparable non-retargeted cohort, not the raw revenue tied to the last click before signup.
Measuring B2B Content Marketing ROI Without Guesswork
B2B content marketing ROI is measured through content-influenced pipeline, time-to-value lag, and assisted-conversion tracking — not pageviews or downloads. Content rarely closes a deal on its own; it shapes the buyer’s decision long before a sales conversation starts, so last-touch attribution almost always undervalues it.
Content-Influenced Pipeline
Tag every content asset in your CRM and tie it to deals where that content was consumed anywhere in the journey — not just as the first or last touch. The resulting “content-influenced pipeline” figure is usually far larger than what last-touch models credit, and it’s the number that actually justifies your content marketing budget in a boardroom.
Time-to-Value Lag
Content ROI shows up late. A whitepaper published in January might not influence a closed deal until October. Measuring content marketing ROI on a 30- or 60-day window will always undersell its performance. We generally recommend a 6 to 12 month lookback window for cornerstone content, and a shorter window only for bottom-funnel assets like case studies and pricing comparisons.
Assisted Conversions vs Last-Touch Bias
Pull an assisted-conversion report from your analytics platform before you cut a content program. Last-touch models routinely undervalue blog content, ebooks, and case studies by 40% or more because these assets do their work early — they’re rarely the final touch before a form fill, even when they’re the reason the prospect took the meeting in the first place.
Building a B2B Marketing ROI Reporting Cadence That Holds Up in the Boardroom
Monthly vs Quarterly Reporting
Monthly reporting works for top-of-funnel metrics — traffic, engagement, lead volume. Revenue-tied ROI needs a longer cadence that matches your actual sales cycle. Reporting revenue ROI monthly in a business with a five-month average sales cycle just produces noise that gets misread as signal, and someone inevitably makes a budget cut based on a single bad month that was never statistically meaningful.
Normalizing for Deal Size Outliers
One enterprise logo can single-handedly make an entire quarter’s ROI look phenomenal — and mask a channel that’s actually underperforming everywhere else. Report a median deal size alongside your average, and consider excluding statistical outliers (deals 3x above your typical contract value) from channel-level ROI comparisons so one whale doesn’t distort what’s really working.
Conclusion
Getting B2B advertising ROI calculation methods right isn’t about finding one perfect formula—it’s about matching the right method to the right question, and being honest about what each one can and can’t tell you. This is exactly the gap Developed Ventures was built to close. We help B2B companies build content and campaigns that actually deliver real value.
B2B Advertising ROI Calculation Methods Frequently Asked Questions
What’s the best way to calculate B2B advertising ROI calculation methods for a long sales cycle?
Use a rolling cohort window that matches your average sales cycle length, not the calendar quarter. Combine pipeline-weighted ROI for early signal with actual closed-won revenue for final validation, and layer in incrementality testing periodically to confirm your attribution model isn’t overcrediting organic demand.
How is B2B marketing ROI different from B2C marketing ROI?
B2B marketing ROI has to account for long, multi-stakeholder buying cycles, higher deal values, and a much wider gap between first touch and closed revenue. B2C models optimizing for single-session conversions simply don’t translate—B2B needs multi-touch attribution and cohort-based tracking instead.
What B2B marketing ROI metrics should I report to executives?
Cost per opportunity, pipeline-weighted ROI, LTV:CAC ratio, and content-influenced pipeline are the four B2B marketing ROI metrics that hold up best in executive reporting. Skip raw lead volume and pageviews—they don’t correlate strongly with revenue and invite the wrong budget conversations.
How do you measure B2B content marketing ROI if content doesn’t directly convert?
Track content-influenced pipeline using assisted-conversion data and a lookback window of six to twelve months for cornerstone assets. Since content typically shapes decisions early in the buyer journey, last-touch attribution alone will always undervalue B2B content marketing ROI—assisted-conversion tracking corrects for that bias.